As part of the wider brief for the The Way We Are Now report, Relate commissioned me to find an interesting and highly visual way of communicating the key findings.
The brief was to emcompass ten different statistics in one image – with an overarching theme that tied in with the subject of the report – the state of the UK's relationships.
Working closely with the communications team, we settled on the vison of a 'house' that brought together separate modules of information as it's rooms, using simple pictograms and household objects to visualise the data.
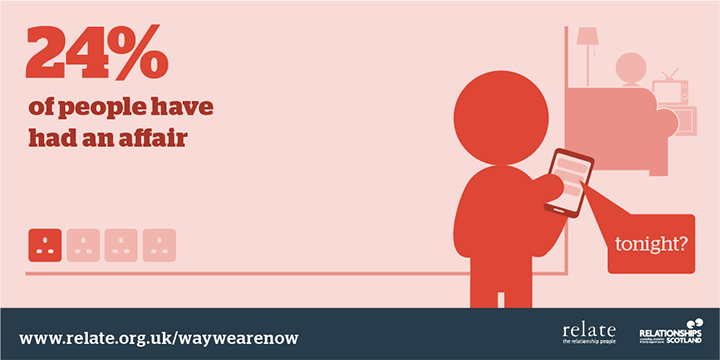
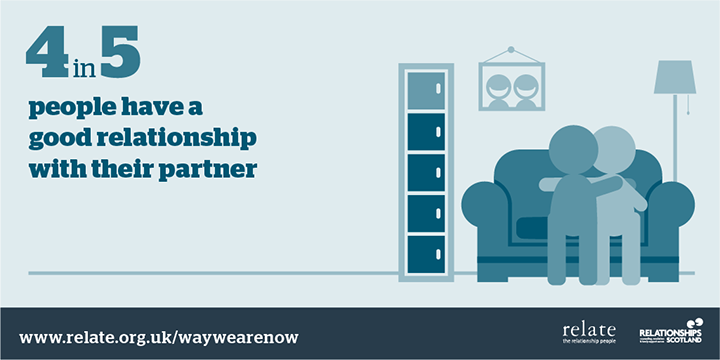
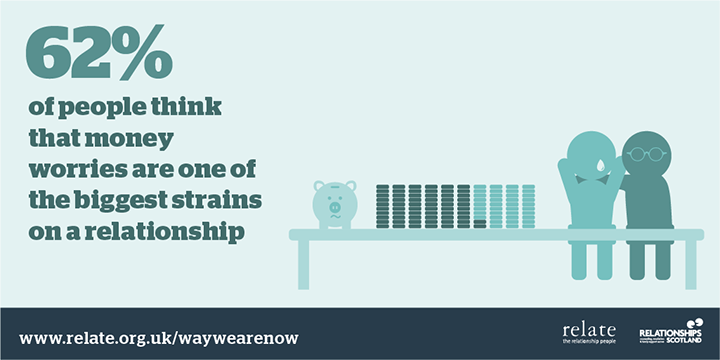
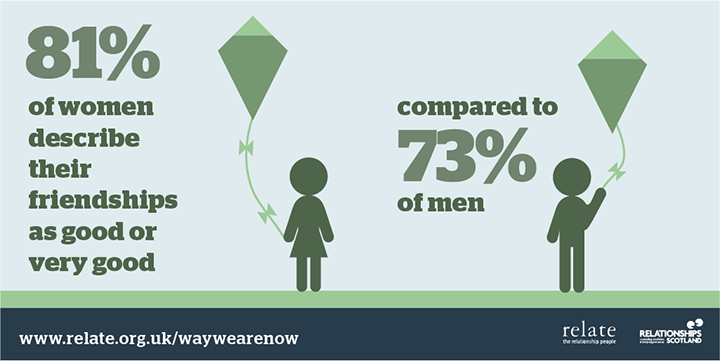
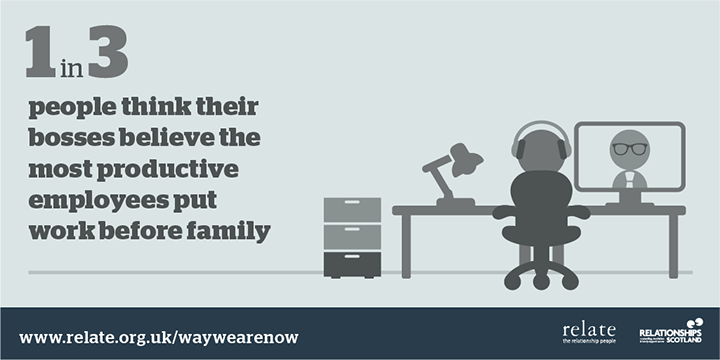
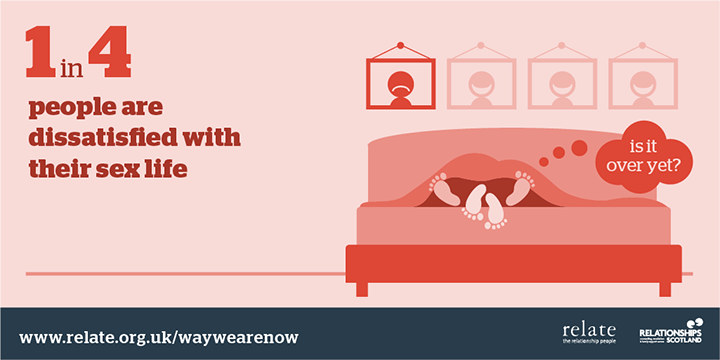
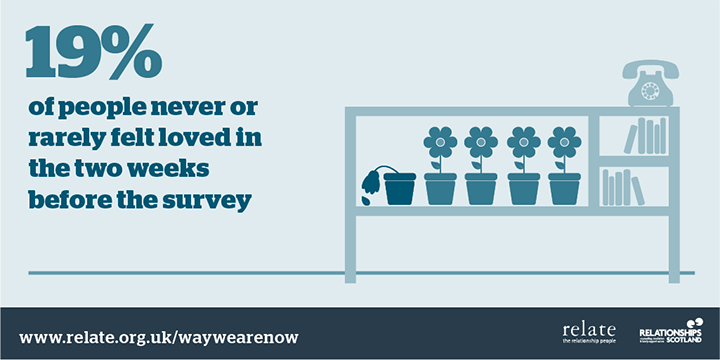
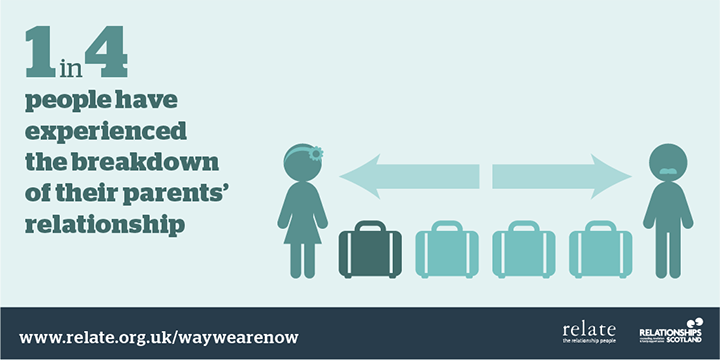
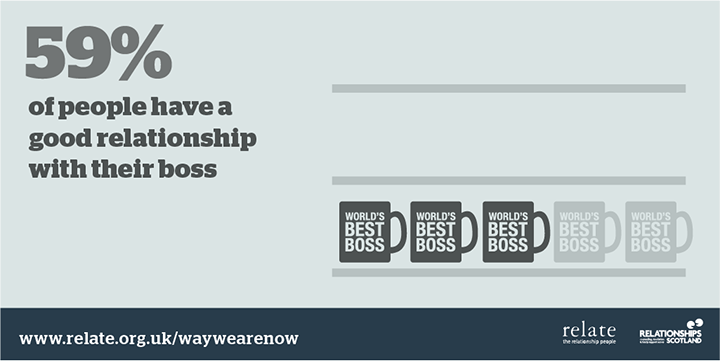
To ensure interest across social media platforms, the statistics were also made available as individual twitter and facebook image posts, rolled out over the publication launch week.
See the infographic in detail here.